Getting Started with the LiveNX Network Monitoring Dashboard
IT teams are constantly inundated with alerts, requests, and a multitude of daily tasks to properly monitor and manage the network. One of the best tools in any good tech professional’s arsenal? A comprehensive performance dashboard. It is one of the most important aspects of any modern network monitoring solution. From this dashboard, one can quickly see a visual representation of your network’s performance – and is probably the screen your team will see most often. While it may seem like a simple aspect of a larger solution, it can be a major factor in proactively monitoring the network and providing a superior user experience.
LiveAction’s premier network visibility solutions bring together sophisticated monitoring, alerting, and troubleshooting capabilities – all from a single pane of glass. But what does that mean? We provide a simplified view of the network from a highly customizable view. Our developers focused on key components that will make any engineer’s day a bit easier:
Real-time network monitoring updates
Unified data from a single screen
Highly customizable views and alerting (to track exactly what you need to see at a glance!)
Clean UI with powerful visualizations of data
Exploring our Network Monitoring Dashboard
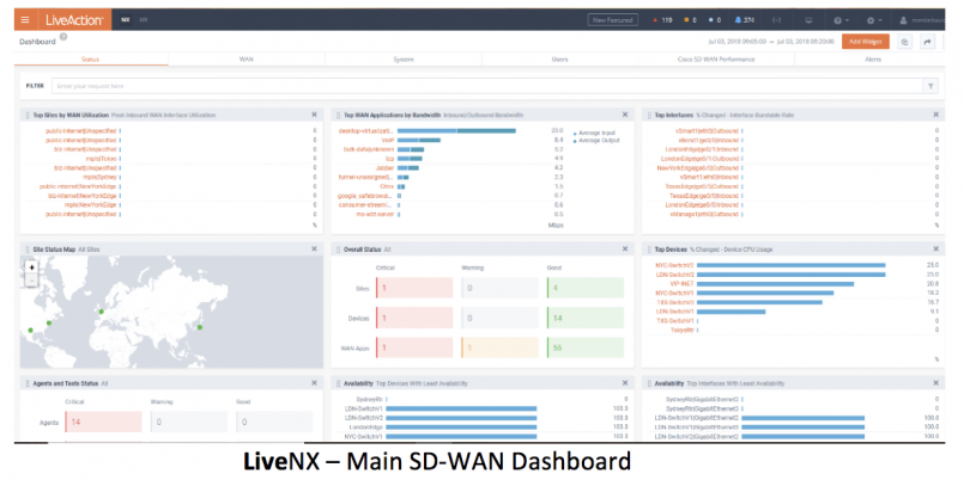
Let’s take a look at what the dashboard can provide immediately with minimal customization. You get eyes on the sites, devices, interfaces, and active alerts from our overview dashboard. Every time there is a performance issue affecting a site, those will be displayed up top to sort by status and performance.
You can apply a filter if you don’t want to focus on something specific like a site, device, interface, service provider, tag, WAN, or region! The solution will only show you what you want to see.
Exploring your active alerts, you can see a list of details such as status and time, source info, and description. Maybe you want to see the packet loss alert event or check out the path that the traffic took — through the LiveNX network monitoring dashboard, you get a high-level understanding of the performance of the network and drill down or filter by specific data.
Unify Your Network Data
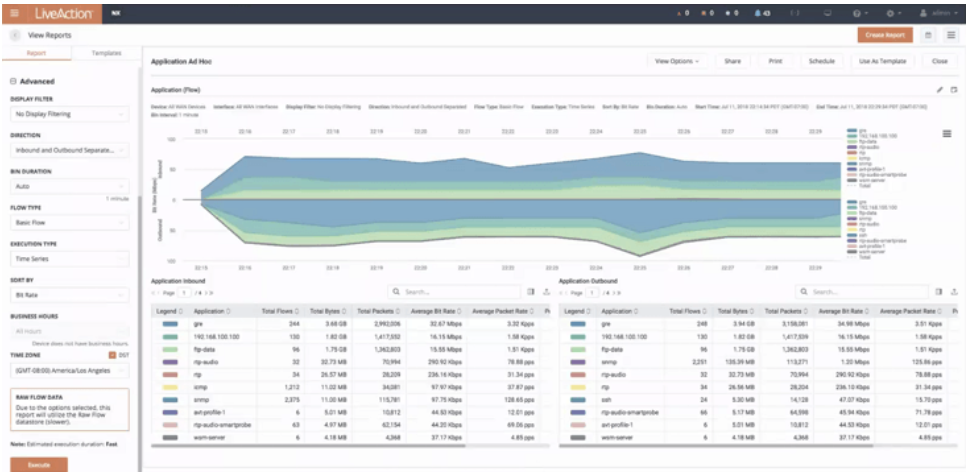
These dashboards are important for a network management team because it allows them to monitor network interface and component health. We provide out-of-the-box standard reports and customizable report templates for network operations teams, executives, and capacity planning.
Organizations benefit greatly from the sophisticated analytics engine and AI features. But in addition to these under-the-hood features, NetOps teams will find daily benefits from the network data visualizations created by network monitoring software, allowing teams to understand at-a-glance the health of their public and private network traffic, and with interactive capabilities to drill down into the details of flows and devices.
How We Help Your Enterprise Succeed
Partnering with LiveAction to ensure a smooth deployment of Cisco WAN technologies, this digital financial establishment needed assistance with planning, optimization, and configuring the network for this digital transformation.
The financial institution utilized LiveNX’s patented visual analytics and dashboards to monitor alerts, WAN utilization, and drops. Their NetOps team leveraged application dashboards to monitor the performance of their most popular applications, used QoS dashboards to identify performance trends (at sites, for application groups, and with their service provider), and optimize their WAN capacity planning with easy-to-use reports.
Ultimately, the bank found that LiveNX provided the scale and breadth of functionality needed for enterprise visibility, path analysis, and ongoing WAN capacity planning needed for a successful WAN deployment.