Remote work taught us a lot about trust – occasionally with carrots, but often with sticks. Some people and teams are still productive, whereas others should be supervised and guided. And here’s a decision you have to make: fight the effects or foresee the future. The first is too risky to take. The second equals having to analyze tons of data.
Don’t worry, Zecurion Next Generation DLP 11 will make User Behavior Analytics a breeze, leaving no dark reaches in cybersecurity. The solution ensures a complete view of risks with 5 additional parameters, anomalies and behavior profiles, work time and productivity, connections diagram, and many more.
If that’s not enough, you can connect via an employees’ webcam or review his/her desktop in real-time at any moment.
Easy Start
1. Activate “Behavior and emotional analysis” in Settings (Main Menu) –> Behavior Analysis. 2. Chose frequency of the Activity Index update:
Every 30 minutes;
Every hour;
Every 3 hours;
Every 24 hours.
3. Enable the “Generate events when the specified Activity Threshold is exceeded” option and define the Activity Threshold. Set your response in the “Reaction to events” section of the Settings menu. 4. Turn on the “Detect anomalies” option. They will be displayed in the Behavior Profile tab of the Employee Profile. 5. Set a schedule for updating average values to regularly recalculate Behavior Change Index.
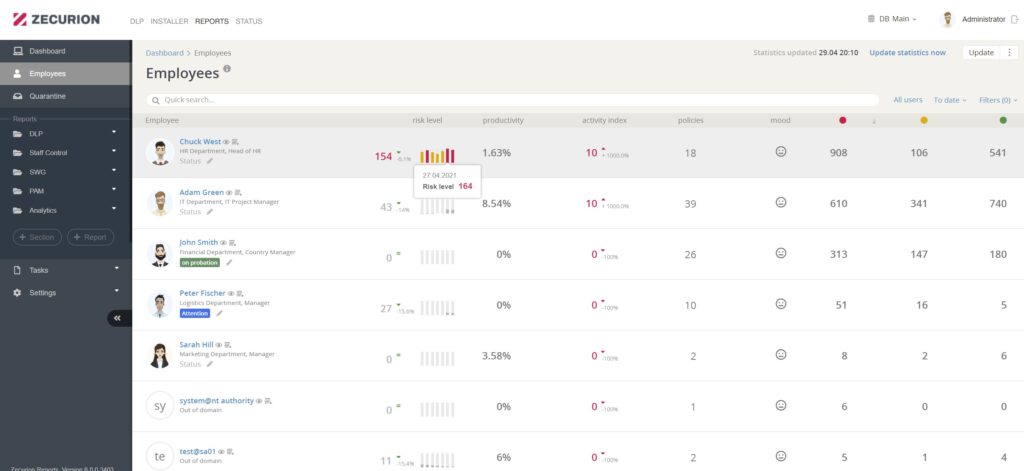
Consolidated report
In the consolidated view, you can see all employees with their evaluation on main parameters: risk, productivity, policies, and emotional state. Configure the display using filtering and quick search. Now, let’s dive into the employee’s profile
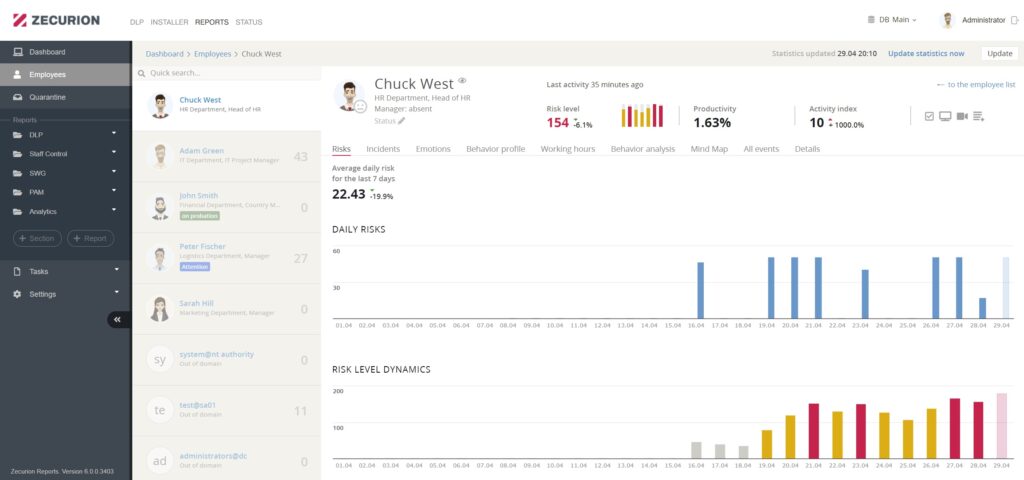
Risk model and behavior profiling
Zecurion Next Generation DLP 11 provides a risk score and change dynamics to assess each employee. For quick search and acquaintance use a header with indicators and hotkeys.
To make analysis even easier use Behavior profile, collection of patterns of specific behaviors, to identify employees with similar characteristics. If you see similarities, threatening your data, you can put these users under closer supervision.
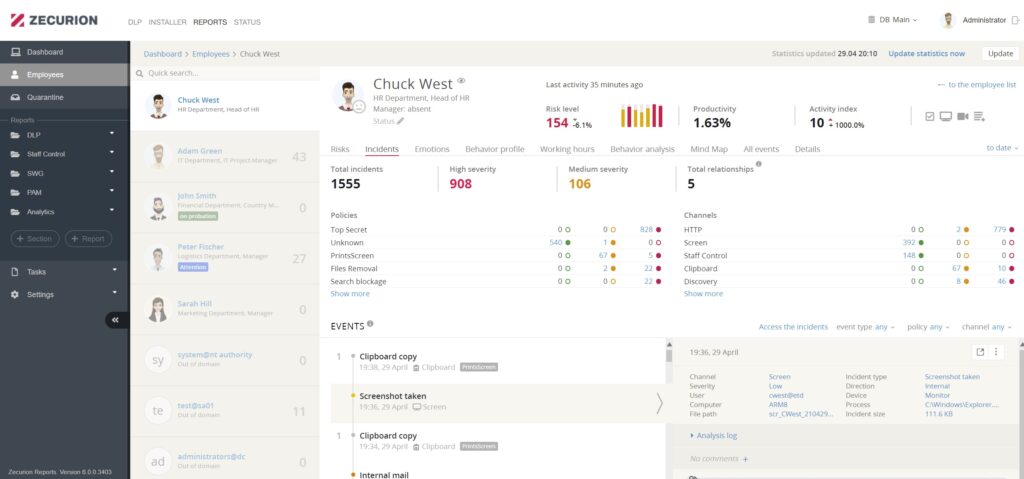
Incident summary
This tab shows all cybersecurity events associated with a user on a single page. Choose required period in the drop-down menu at top right:
today;
yesterday;
current week;
last 7 days;
current month;
last 4 weeks;
current year;
all time;
period.
By choosing “period”, you can set the exact date and time of the beginning and the end of observation. Click on the calendar icon to choose the most suitable dates.
Now at the top of the page, you can review brief information on various incidents and user connections, and which incidents were high or medium severity.
Lower are two tables displaying incidents of different severity with channels they utilized and applied policies.
At the bottom of the page, you can review all events in chronological order. Click any event to see details on the right.
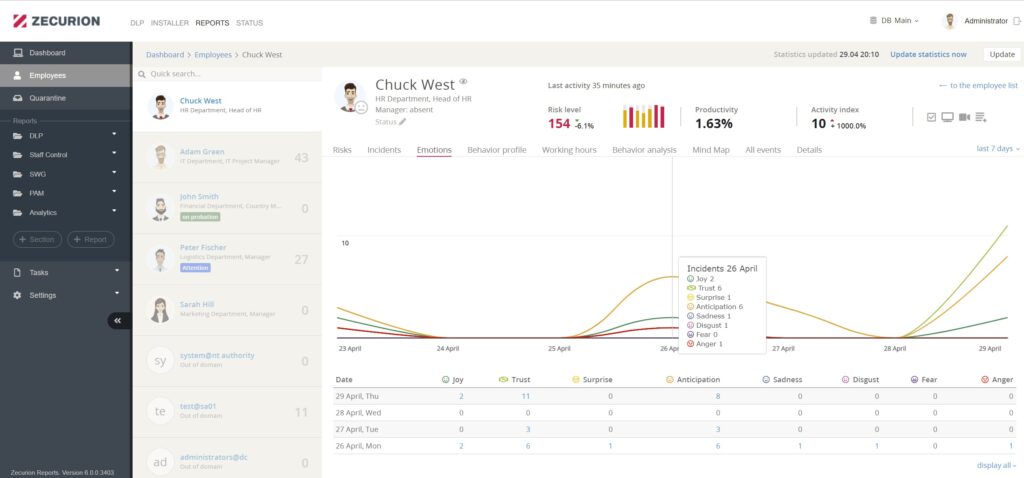
Employee emotions
Zecurion DLP 11 calculates an employee’s emotional state by analysis of his/her outgoing messages. Each can receive up to 3 emotional attributes of the following: joy, trust, surprise, anticipation, sadness, disgust, fear, and anger.
You can see dynamics on each emotion, highlighted by respective color.
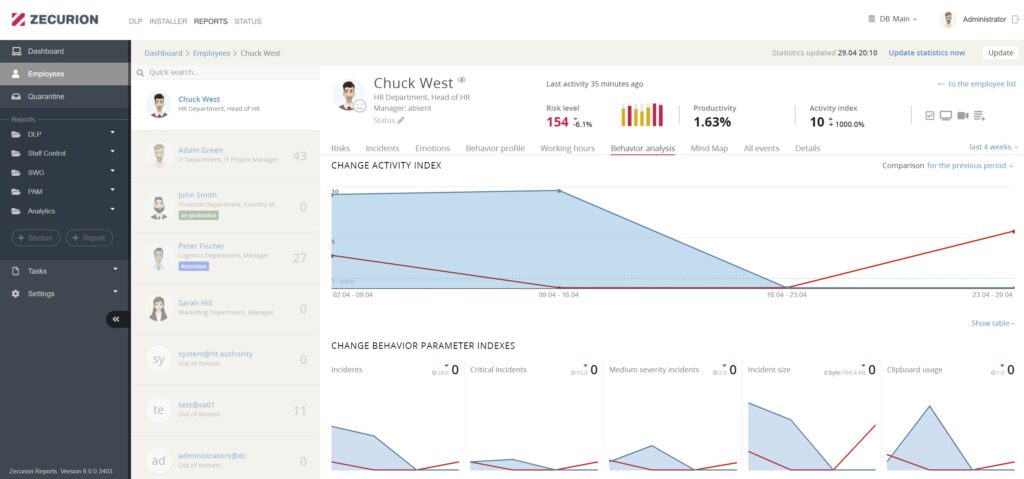
Behavior analysis
Tab “Behavior analysis” shows employee Activity index and its dynamics within a chosen period. You can see activity within the last 7 days or 28 days. Choose time in a drop-down menu on the top right corner of the page.
For easy maintenance check the activity index dynamics graph at the top of the page. Its current value also displays in the employee card title and the summary report of the “Employees” section.
The behavior index is an integral indicator reflecting how much the current characteristics of user behavior differ from average values. Zecurion DLP accumulates data that characterize employees on a variety of parameters:
Incidents;
Critical incidents;
Medium severity incidents;
Incidents size;
Clipboard usage;
The volume of transferred files;
Number of transferred files;
Number of files;
Recipients.
The system calculates average statistical indicators every week to determine the behavioral profile of employees.
Click “Expand table” / “Shut down table” under the main graph to see Behavior Parameter Indexes. You can see dynamics for each parameter within a chosen period in a corresponding graph. Click on the graph (except for Recipients) to build a report on the dynamics of a specific parameter within a time.
UBA compares current employees’ parameters with their average values. A sharp deviation may signal a potential threat to information security or indicate a compromise of user credentials.
Still, it’s impossible to perform behavior analysis for the users, appeared less than a week ago. In this case “Not enough data” sign will pop up.
If you need to compare an employee’s behavior to the group’s average, turn on the “Comparison” tab in the top right of the page. The line on top of the graph will display the difference between a similar period in the past for the same employee and group average (red) and current results (blue).
Compare particular employees or add group average to see complete picture clearer.
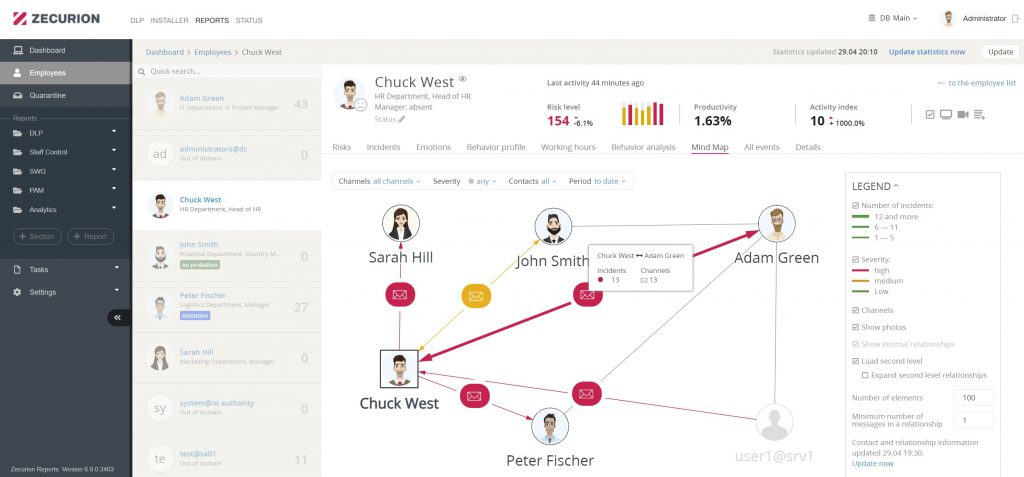
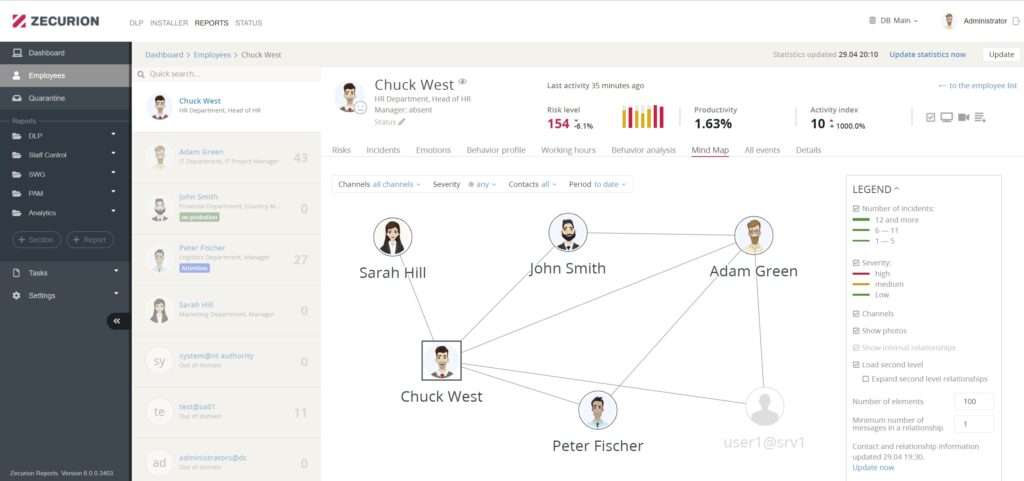
Connections diagram
Use the “Connection Map” tab to see employee’s active connections via email or messengers.
All events
Tab “All events” lists all incidents associated with the employee in a chronological feed. This includes employee security incidents and events from the Staff Control Module. Choose the required period in the drop-down menu at the top right:
today;
yesterday;
current week;
last 7 days;
current month;
last 4 weeks;
current year;
all time;
period.
By choosing “period”, you can set the exact date and time of the beginning and the end of observation. Click on the calendar icon to choose the most suitable dates.
Events feed can display up to 1000 incidents. To show more, use filters.
In the left half of the page, you can see an event feed. Each event is marked: name of event, date and time, icon, and name of a channel, policies applied. When you click on an event, you will see details in the right part of the page. For incidents, it will be a date, time, policies, tags, incident parameters, analysis log, attachments miniatures. For Staff Control events you will see a date, time, tags, event parameters.
Use the “Go to incidents” button in the top right to see the report archive on incidents within a chosen period. You can filter events by:
type with a drop-down menu of events;
a policy with a drop-down menu of all applied to a particular employee;
channel with a drop-down menu of all ones used.
There is a colored icon next to each channel. If you don’t want to specify parameters, proceed with “any”. Click an icon in the top right of the page to see the event on the full screen. Open the “Send” option to share an incident. Or export an incident in the required format to add to forensic investigation documentation.