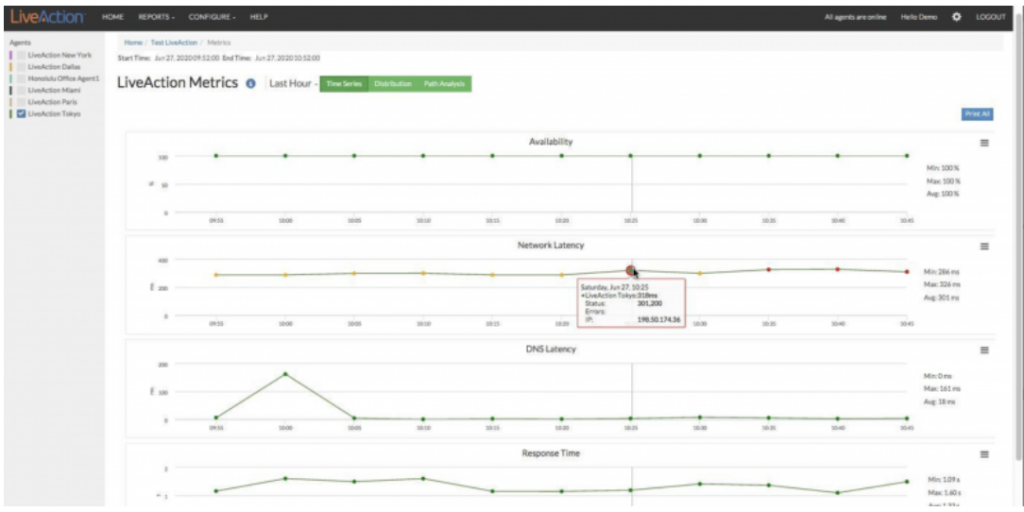
A network monitoring dashboard is one of the most important features within an all-inclusive network monitoring solution. A dashboard is the visual representation of your network’s performance and will be the day-to-day view a network team sees most often.
The beauty of customizable dashboards is it’s all about catering to a network team’s specific needs. On a daily basis, these teams are looking at a lot of complicated data, static or incomplete visibility can leave a lot of room for error. A customizable dashboard allows for specific parameters and get a view of your website’s performance and availability and know if there are any problems with your applications.
Custom dashboards are a great way to see the bigger picture and allow users to obtain a more detailed report of network processes. Teams can set up alerts to have proper insight into the problem immediately.
Customize with LiveNX
Previously, LiveAction introduced the power of unifying your data with LiveNX and what their performance and reporting dashboards can do for your day-to-day. Users can simplify their dashboards and reporting with out-of-the-box standard reports and customizable report templates for network operations, executives, and capacity planning. Reliable real-time reporting leads to streamlined and high-quality network service.
The single-screen dashboard aggregates system health, sites, and configuration views; including the ability to customize views of widgets, data sets, and format. There are several predefined templates for widget design, with pulldowns for custom filters on different datasets. Within each window is the data you want to see, where you want to see it.
Monitoring application performance for delays is easier than ever with filtered views. Get specific with the data you want to see and full visibility across the entire enterprise while consolidating tools into one single pane of glass.
Network Management Made Easy
Engineering teams find the simplified access to network performance data a huge asset when troubleshooting performance issues. Reduced MTTR is just one of the benefits of unifying key network monitoring data types, including network packets, onto a single platform with visibility across the entire network.
With LiveNX you can establish application and network performance baseline with real-time capture of line-rate raw flow data combined with filtering and big-data analysis and reporting. Teams can also quickly resolve complex incidents that involve different systems, vendors, devices, and software with a rapid incident response workflow with alert notification and predictive insight.
Bringing It All Together
Teams can correlate multiple data sets to provide views, graphs, and maps to illustrate the current state of applications and network performance.
They can also:
Gain visibility into underlay and overlays, tunnel performance for SD-WAN deployments
See the entire network by unifying data from virtually anywhere – WAN, SD-WAN, WIFI, remote sites, data centers, and multi-cloud including AWS and Azure.
Automatically do a device discovery and quickly create an exhaustive inventory of every Device and Interface in the network
Utilize application and path visualization to effectively validate WAN ROI for traditional MPLS, hybrid, or SD-WAN. Gather real-time data from both multi-vendor network elements.