How to View Sites, Devices, and Interfaces in LiveNX
As the network grows more complex, it becomes clear that proper network monitoring software is essential for an optimized business. Whether you’re monitoring real-time traffic or ensuring sufficient bandwidth by capacity planning having network monitoring software in place will lead to resolving network issues faster and more.
Comprehensive visibility is easier said than done, but with the help of network performance dashboards, IT teams can expedite network troubleshooting and improve optimization of multiple interrelated network technologies.
Within the network performance dashboard, you can:
Get an at-a-glance gain views across your entire network
Easily navigate from overview or geographic view to a specific site, device, or interface of interest
Layouts come pre-configured but can be easily customized based on uses cases and needs
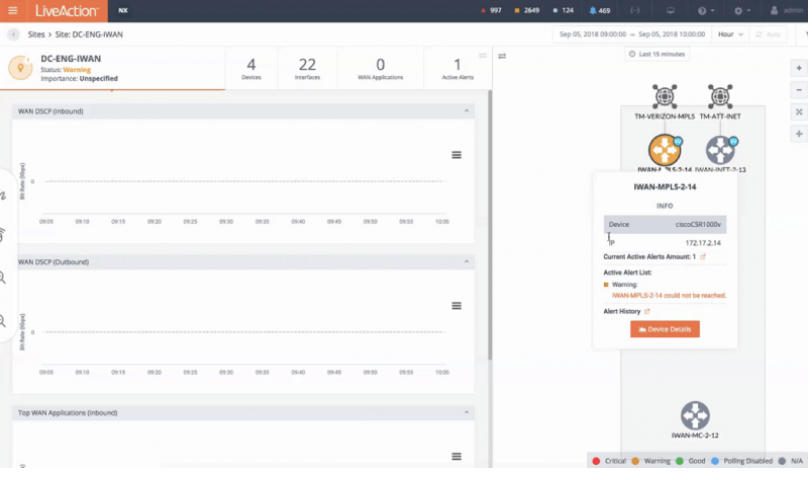
However, not all network monitoring dashboards are created equal. LiveAction’s patented visual analytics provide Network Operations with the features needed to see the entire network, proactively identify issues before they happen, and quickly fix networked application issues. When specifically looking at Site / Device / Interface Dashboards these can:
Use network performance dashboards to quickly analyze and drill down into the health and performance of the network.
Easily navigate to the dimension of interest, such as site, device, interface. These can be analyzed for the last 15min, hours, days, weeks, and more.
Available data within dashboards include Top Applications, Top DSCP, Top Conversation, Interface Bandwidth, Interface Utilization, Interface Errors, and QoS Drops.
Finding the Needle in the Haystack
Unify data is a key capability for any IT team and LiveNX does more than just that. Looking for something specific? Automatically do a device discovery and quickly create an exhaustive inventory of every device and interface in the network.
Get high-level views into packets quickly, cross launch into packets, and use filters to drill down and get all details you need to get full visibility into network and application performance. Filtering within the dashboard will assist in determining if performance issues are being impacted by the network or an application. This will allow IT teams to properly calculate response time and improve end-user experience.
Our dashboards are highly configurable to provide you with the views you need to identify issues across your entire network. IT teams have access to customizable widgets such as the range from Top Application, Top Interface Utilization, Top Availability per Site/Device/Interface, Top Application Performance, Top Voice/ Video Performances, and many more. Each user can have 12 Dashboard tabs with 9 widgets each. Dashboards can also be copied and shared amongst users.
Optimize your entire network by improving visibility and situational awareness of network performance by using quick and easy-to-network performance.